
Economic Impact Dashboard
MARKET OVERVIEW Q1 2025
To gain an understanding of the current business environment and market potential in Downtown Tempe, statistics are collected and analyzed in the retail, residential, and hotel markets on a quarterly basis. In addition, an inventory of all street-level establishments in the downtown district was conducted the week of April 7, 2025.
Retail
There are 176 street-level retail businesses currently downtown. 4 new businesses opened and 0 businesses closed between January - March 2025. Dining remains the dominate retail category with 76 food establishments or 43% of total businesses. 45, or 59% of the dining establishments are independently owned and offer a broad spectrum of cuisine. 9% of businesses are in the nightlife category, and 5% are in the hotel category bringing a total hospitality category to 57%.
- 116 or 67% of the downtown street-level businesses are considered local & independently owned.
- 23% are BIPOC-owned businesses
- 22% are female-owned businesses
- There are 27 current street-level vacancies.

Q1 New Businesses
Freddy's Frozen Custard & Steakburgers
Neon Spur
Filthy Animal
Drop Dead Gorgeous
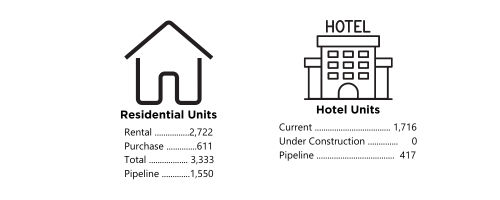
Residential & Hotel
Downtown Visits Q1 2025

Source: Placer.ai