Reports & Research
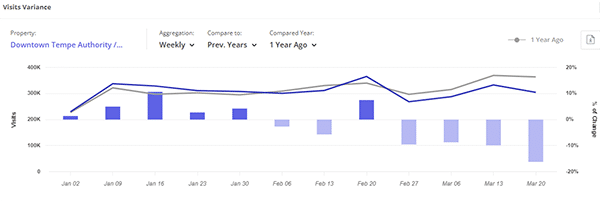
Economic Impact Dashboard
2020 Tempe Mission Campaign Report
2018/2019 Annual Report + 2019/2020 Workplan
2019 Merchant Analysis Report
2018/2019 Workplan & Budget
2018 Merchant Analysis Report
2017 Economic Impact Report
2017 Stakeholder Analysis
2017/2018 Workplan & Budget
2017 Merchant Analysis Report
2016/2017 Annual Report
2016/2017 Clean & Safe Annual Report
2015/2016 Annual Report
2016/2017 Workplan & Budget
2016 Economic Impact Report
2016 Merchant Analysis Report
2015 Merchant Analysis Report
Downtown Data
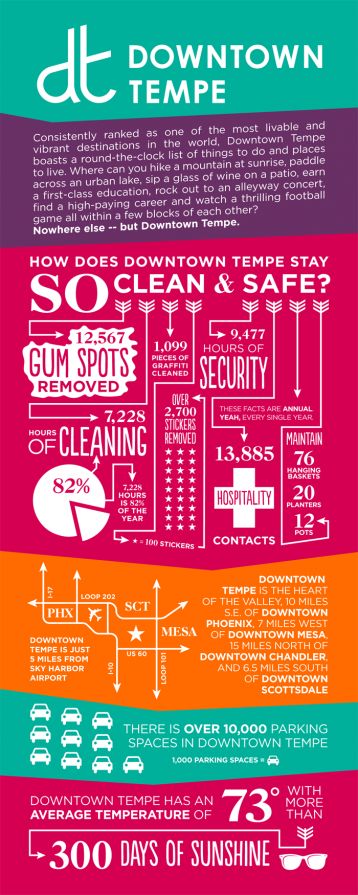
| Downtown Safety Patrol (Annual) | Downtown Ground Support (Annual) | ||
|---|---|---|---|
| 9,477 | Downtown Safety Patrol Hours | 7,228 | Downtown Cleaning Hours |
| 13,885 | Downtown Hospitality Contacts | 12,567 | Gum Spots Removed |
| 4,176 | Homeless/Transient Contacts | 2,735 | Stickers Removed |
| 3,100 | Requests for Skateboarder/Bicyclists to not use sidewalk on Mill Ave. | 1,099 | Graffiti Removed |
| 1,168 | # of Plantings in Plant Fixtures | ||
Estimated 1,100,000 people attend events annually, including Downtown Tempe and Tempe Town Lake.
Click here for our downloadable Brag Sheet.
2015/2016 Downtown Tempe Authority Workplan & Budget
2014/2015 Downtown Tempe, Inc. WorkPlan and Budget
